
Getting the Most From Your SAS Logging Part 3
Log Analytics with Grafana Loki
Author(s): Maciej Baranowski
Introduction
If you’re a SAS system admin, you’re familiar with logging. This is the third of the three-part blog series dedicated to exploring the range of solutions which help SAS administrators diagnose platform issues and decrease time to resolution of outages and issues.
Our first blog talked you through configuring a uniform logging architecture using log4j. The second blog focused on incorporating the Elastic Stack with SAS to provide a fully-fledged centralised log solution.
This final blog focuses on the implementation of Grafana Loki with SAS, as well as identifying scenarios for each solution’s use that we covered in the previous blogs.
The incorporation of Loki alongside your current SAS deployment provides a means of troubleshooting logging errors quickly. Read how it compares to the Elastic Stack.
What is Grafana Loki?
Loki is a horizontally scalable, highly available, multi-tenant log aggregation system inspired by Prometheus. It is designed to be very cost effective and easy to operate. It does not index the contents of the logs, but rather a set of labels for each log stream1.
Grafana is an open-source analytics and monitoring solution and has become the defacto dashboarding solution for time series data.
Leveraging the tight-knit integration with Prometheus, Grafana offers a wide range of powerful dashboard visualisations – all of which are useful when monitoring and administering a system of any scale and complexity.
Grafana, Prometheus and Loki complement each other perfectly to provide an all-in-one Alerting and Monitoring platform as well as Logging and Audit solution, two of the pillars in Demarq’s five pillar Environment Management methodology.
Why is Loki Important?
Like the Elastic Stack, the incorporation of Loki alongside your current SAS deployment provides a means of troubleshooting errors quickly. Loki is a fantastic addition to your solution stack if you are currently utilising Prometheus to monitor your deployment.
Loki can be used to identify errors and monitor your logs, using LogQL and custom dashboards to give you all the necessary details alongside performance metrics in an easy-to-use, visual format.
System Administrators often find themselves using the staples of the command line, such as tail and grep, open in multiple terminals when monitoring the platform and troubleshooting errors.
Loki, in combination with Promtail, replicates and extends this powerful combination and offers a simpler way to centralise your logs for ongoing monitoring, as well as for problem resolution.
How Loki Fits With SAS
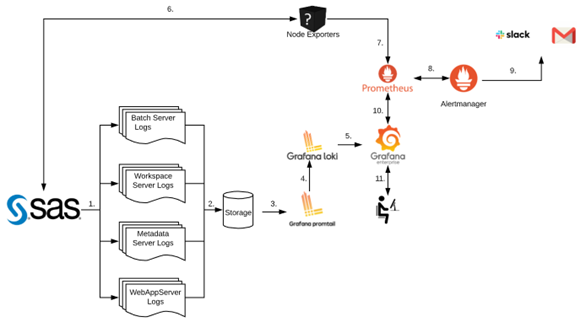
The above diagram shows the steps how SAS and Loki work together:
- SAS sessions, jobs and processes generate log files
- Log files are written to storage
- Promtail tails each log file in real time
- The log files are shipped to Loki for processing
- The log files can then be queried in Grafana
- A variety of exporters expose metrics and/or send probes to the SAS platform to determine status and whether services are running or not
- Prometheus scrapes the exporter results/stats
- Should any specified thresholds or error conditions be met, Alertmanager is notified to send an alert
- Alerts are sent out using a channel of choice. A wide range of alerting mechanisms can be configured, for instance e-mail or Slack.
- The log files can then be queried in Grafana
- User interacts with Grafana by querying the logs through the web interface
How Can Loki Save Time?
Loki, just like the Elastic Stack, provides significant time savings when diagnosing issues that occur on your platform.
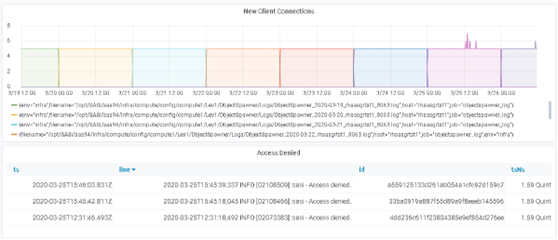
The above diagram shows how LogQL can be used to query all errors occurring in a specific environment. LogQL queries can be run to identify errors in the past as well as monitoring existing logs, thanks to Promtail tailing your logs in real time.
This means that Loki can help with monitoring running jobs and identify any issues quickly.
Authentication issues are a common problem that system administrators are faced with. This could be due to a password change which wasn’t reflected in the configuration, or code for a program that was run. With the help of Loki, system administrators can run ad-hoc queries to determine whether this has occurred, as shown below:
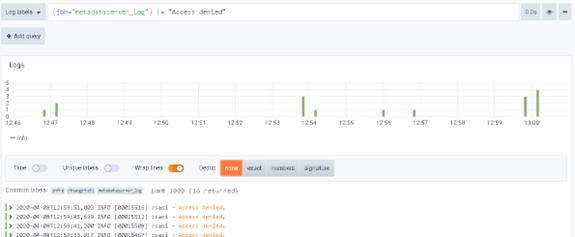
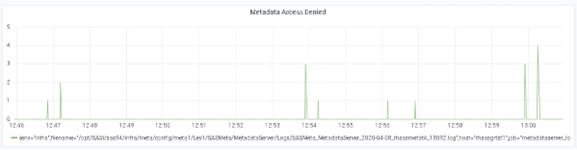
Alternatively, if system administrators find themselves encountering this problem frequently, they can set up a dashboard to have this information available to them at a glance, instantly.
Which is the Best Solution for You?
Both the Elastic Stack and Loki represent two different ways of approaching the same problem. The below table outlines the pros and cons of each solution to help you decide which approach would be best for you.
| The Elastic Stack | Grafana Loki |
| Pros | Pros |
| Utilises Lucene Indexing for quick log retrieval | Indexes labels as opposed to logs for quick retrieval |
| Allows for the monitoring of logs through Kibana Query Language (KQL) and customised dashboards | Allows for the monitoring of logs through LogQL and customised dashboards |
| Log Alerting | – |
| Flexible with plugin integration such as Alerting | Tight integration with Grafana, Prometheus and Alertmanager |
| Useful when you currently do not have a platform monitoring solution | Great addition if you are already monitoring your platform with Prometheus |
| Cons | Cons |
| Elasticsearch does not have multi-language support in terms of handling request and response data (only possible in JSON) | – |
| Scaling may be an issue if you host your Elastic Stack locally | – |
| Big queries may take a long time depending on index size | – |
| – | No log alerting functionality |
Depending on what is currently in place, both logging solutions offer advantages in the way issue diagnostics is performed. Should you already have Prometheus and Alertmanager in your solution stack, Loki presents itself as the tool of choice due to its tight-knit integration.
Alternatively, the Elastic Stack will provide a way to monitor your platform if you are only getting started.
In conclusion, both Elastic Stack and Loki offer unique ways of approaching the same problem; both solutions provide a way to diagnose issues on your SAS Platform.
The Elastic Stack is the solution of choice for system administrators who are beginning to look at platform monitoring, whereas Loki should be used as an extension of an existing Prometheus and Alertmanager solution.