
Getting the Most From Your SAS Logging Part 2
Log Analytics with the Elastic Stack
Author(s): Maciej Baranowski
Introduction
This is the second part of the three-part blog series where we explore the range of solutions which help System Administrators diagnose platform issues and decrease time to resolution of outages.
This blog will focus on incorporating the Elastic Stack with SAS to provide a fully-fledged centralized log solution.
The Elastic Stack
The Elastic Stack consists of three open-source projects: Elasticsearch, Logstash and Kibana. A Lucene based search engine, Elasticsearch’s quick indexing enables Administrators to run complex queries and use aggregations to retrieve summaries of their data.
Logstash is a server-side data processing pipeline that ingests data from multiple sources simultaneously, transforms it, and then sends it to a “stash” like Elasticsearch. Kibana lets users visualize data with charts and graphs in Elasticsearch.
Why Does it Matter?
In a complex solution like SAS, which comprises of many individual components, troubleshooting errors can be time-consuming and tedious.
Debugging an issue often means looking through multiple logs, or even logging into multiple servers.
In order to save time, the Elastic Stack solution can help with automated log collection, aggregation and data visualization, allowing you to fix the issues at hand quickly. Welcome to the world of Log Analytics!
How it all Fits Together
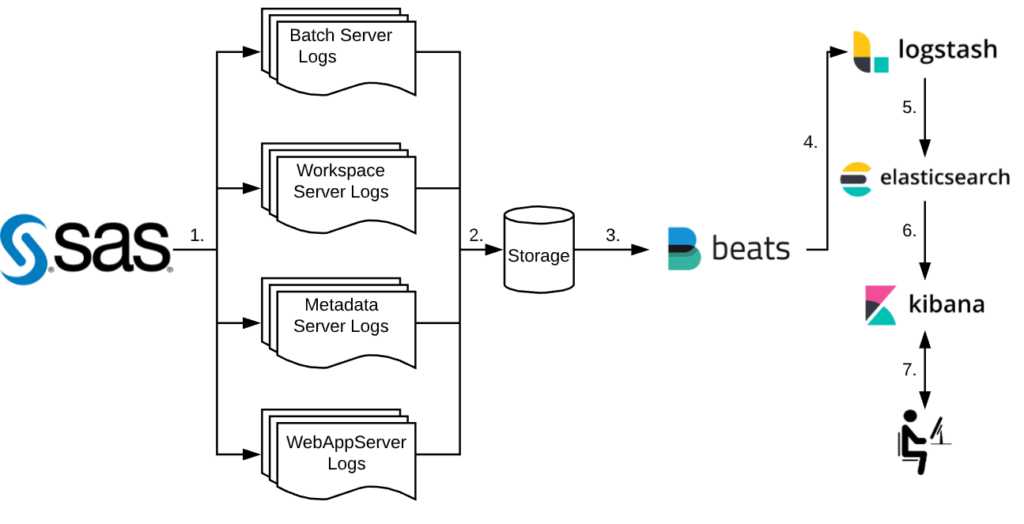
The above diagram shows the steps of how SAS and the Elastic Stack work together:
- SAS sessions, jobs and processes generate log files
- Log files are written to storage
- Filebeat picks up each log file
- The log files are shipped to Logstash for processing
- Logstash then passes the processed logs to Elasticsearch for indexing
- The index can then be queried by Kibana
- User interacts with Kibana by querying the index through the web interface
1.1 Traditional Log Inspection
Traditional log inspection can be slow, depending on the number of components installed on your platform. For example, a SAS Web Application issue can entail going through logs on each tier, which could comprise of multiple machines depending on your setup; Metadata, Compute as well as Middle-Tier issues can take a considerable amount of time to successfully diagnose when checking logs by hand.
Even when using some handy grep one-liners, your investigations can quickly spiral out of control with multiple terminal windows, notepad files and handwritten notes – and then you need to redo it all when creating an incident report.
1.2 The Elastic Stack Way
With the help of the Elastic Stack alongside your SAS platform, this time-consuming task can be transformed into a visually investigative process, using dashboards alongside searches which query super-fast, pre-built indexes of all collated logs.
One search command can search for all possible errors on the entire platform within an (optionally) given time frame. This considerably reduces the time taken to diagnose and fix issues, resulting in less system downtime.
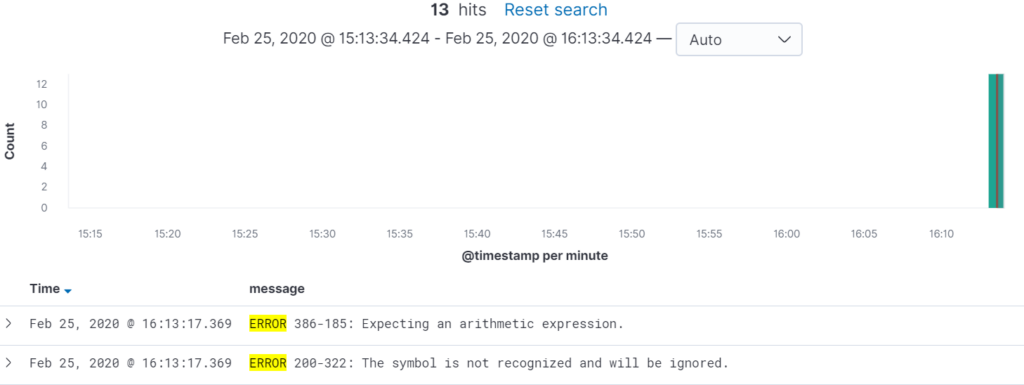
From the graph below, we can see that there were 518 errors across the entire environment between 21:30 and 22:00 on the 17th of February. This is a mixture of errors from all tiers – but any one of these could be the one responsible for the outage.
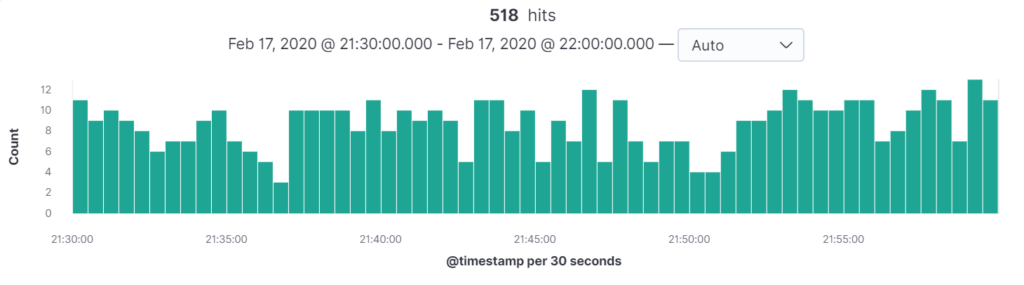
Assuming the incident occurred at 21:59, we can drill down by clicking on the green bars to further reduce the scope. Clicking on the second to last bar from the right produces this updated graph:
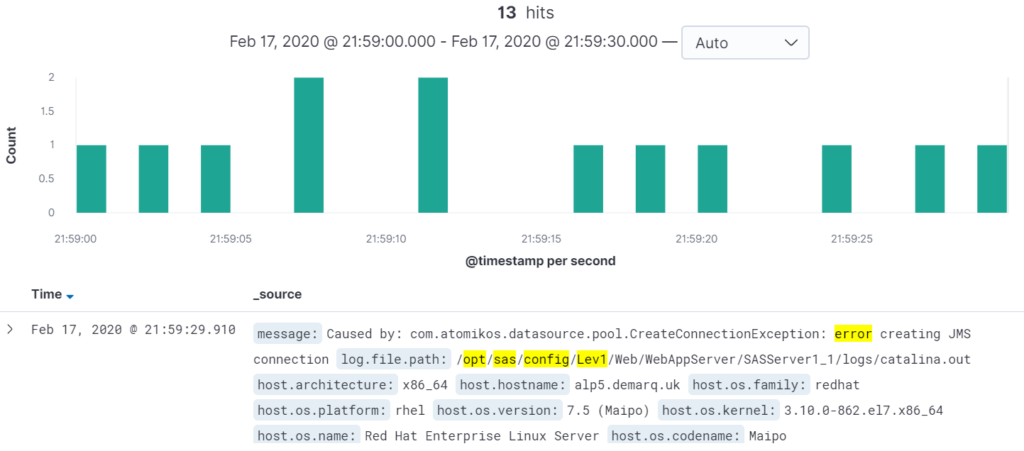
From here, problem diagnosis is easy – we can already see that the issue was caused by an error creating a JMS connection.
How Can I Utilise it?
To get the most out of the Elastic Stack, our recommended setup is to allow Filebeat to ship logs from all areas of the SAS platform, be it the Metadata Tier, Compute Tier or the Middle Tier; each and every log file can become valuable in the event of issues.
1.3 Metadata Tier
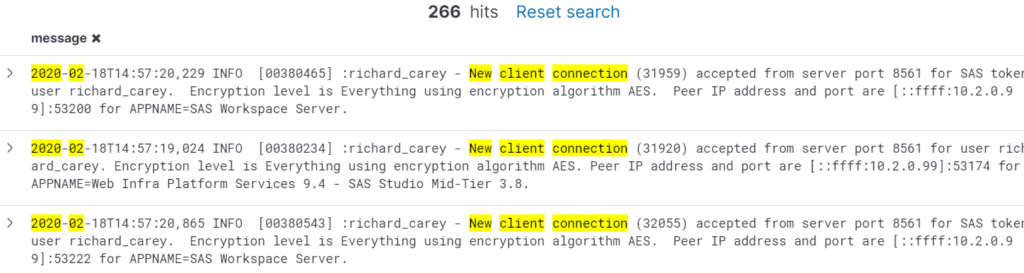
A typical task that SAS Administrators could perform is a check of how many times the platform has been accessed that month. Instead of looking through individual log files and counting the entries, a quick query can be sent to the Elastic Stack to retrieve the necessary information almost instantaneously.
An example of users connecting to the SAS Metadata Server can be seen below:
1.4 Compute Tier
In the event of a batch failure, you could see yourself sifting through hundreds, thousands or even millions of lines of text in a log file, essentially looking for a needle in a haystack. In the Elastic Stack, this looks different. A one-line query can retrieve an output like the one below:
Typical Time Savings
From a case study analysis based on the scenario above, we can estimate the time savings that a SAS System Administrator can achieve by utilising the Elastic Stack as opposed to Traditional Log inspection. Directly comparing the two approaches.
1.5 Traditional Log Inspection
Based on the assumption that the SAS platform Logging Architecture was configured using the guidelines outlined in our previous blog post – Getting the most from your SAS logging tool – we can deduce the following:
1.5.1 Uncertainty where to start
A Web Application failure can stem from a wide range of components. Typically, a SAS System Administrator would work from the ground up, starting from the Metadata Server, working their way through the Compute Tier, getting sessions and, lastly, finishing on the Web App Server Logs should the former tests be successful.
1.5.2 Typical Problem Diagnosis Procedure
- SAS System Administrator would attempt to make a successful connection to the Metadata Server using SAS Management Console to the impacted environment. [2-5 minutes]
- The next step would involve checking the latest Metadata Server Log to verify no errors have occurred between the specified time frame. [2-5 minutes]
- Should the above two be successful, a successful session should be established in SAS Enterprise Guide and code should be run in order to establish that the Compute Tier is functional. [5 minutes]
- Next port of call would be the WIP or SAS Content Server to inspect whether any of these components are responsible for the outage. [2-5 minutes]
- Lastly, the SAS System Administrator would verify that the Web App Server logs contain no errors in them. At this point they will see the root cause. [2-5 minutes]
From the above procedure, the SAS System Administrator may find some possible clues along the way in each of the log files, which they will investigate further.
Copying, pasting and researching uses valuable time and could bring you no closer to resolution that you were at the start. [20-30 minutes depending on amount of research conducted]
Total time taken: 33-55 minutes
1.6 The Elastic Stack Way
1.6.1 Uncertainty where to start
Although the initial uncertainty of the root cause remains the same, the Elastic Stack has the advantage of being able to query all logs from a central dashboard using one set of queries. Elastic indexing makes these queries super-fast.
1.6.2 Typical Problem Diagnosis Procedure
- The SAS System Administrator would open the Discover tab on Kibana and apply a timeframe in which the outage occurred. In this instance; February the 17th between 21:30 and 22:00. [30 seconds]
- Next, filters for the data will need to be set. A filter for the filepath which will encapsulate all logs on the platform – <SAS_CONFIG_LOC> – is ideal. The filter for the log message matching “error” will be set also. [10 seconds]
- The SAS System Administrator will then be presented with the number of errors on the platform at that time. They can click through each minute of that interval and investigate whether this error has any significance to the outage at hand. [5-20 minutes depending on whether any further research must be made in relation to the errors seen]
Total time taken: 1-20 minutes
1.7 Taking things further
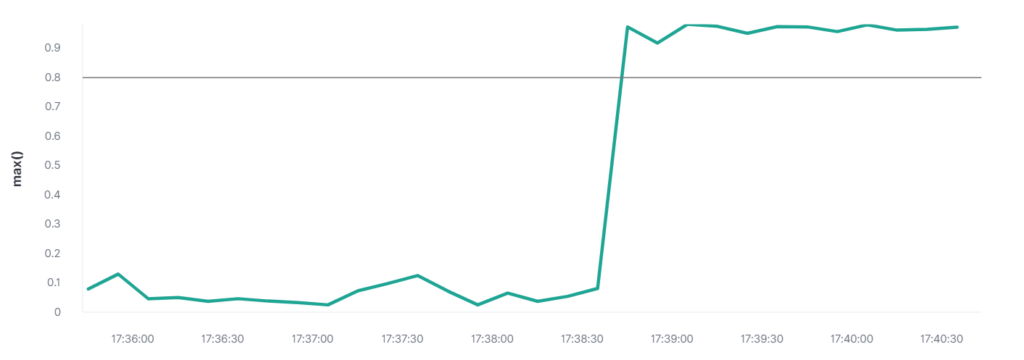
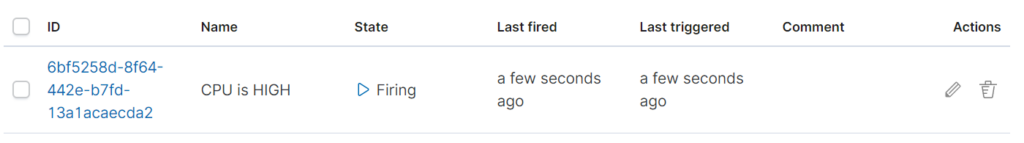
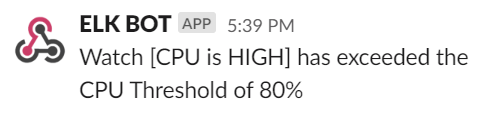
Since Elastic is already scraping and indexing logs, thresholds and limits can be setup in Kibana to automatically alert based on certain criteria. For example, a high CPU usage percentage can be critical to the stability of the SAS Platform.
An example of a threshold alert can be seen below, sending a message to a webhook alerting of high CPU usage.
Conclusion
In conclusion, the deployment of the Elastic Stack, in tandem with SAS, offers the benefit of monitoring the entire deployment through a single dashboard interface.
Combine this with customisable threshold alerts, SAS System Administrators are able to perform their duties in a proactive manner, as opposed to reactively responding to platform issues.
This reduces system downtime and allows administrators to focus on administrative tasks rather than resolving system outages – in some cases pre-empting issues by taking proactive measures